


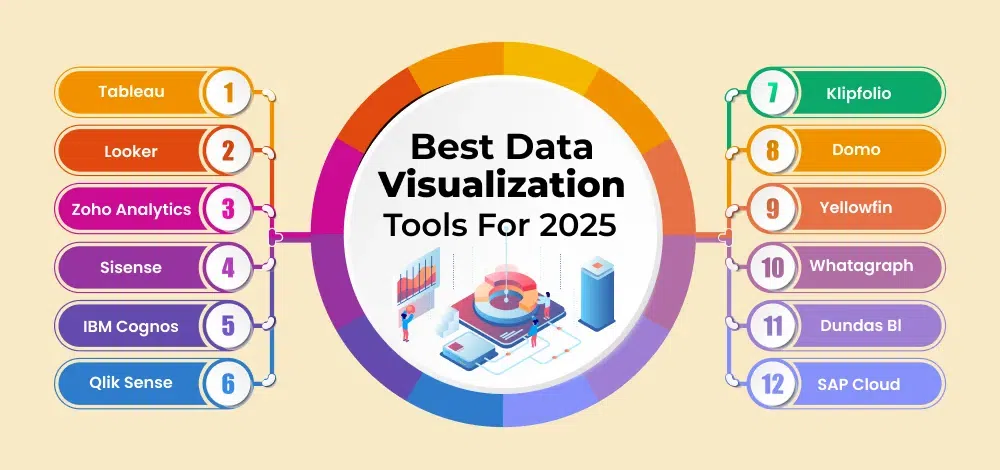
Data visualization is a crucial aspect of analytics, helping businesses and researchers communicate insights effectively. Some of the most powerful visualization tools include:
Data visualization tools help businesses track KPIs, monitor performance trends, and identify anomalies. For example, a retail company can use Tableau to visualize sales data and optimize marketing strategies.